Quantcast
Channel: Business Advantage's Blog
Viewing all 22 articles
Browse latest View live

Best Future CAD Growth Opportunities

$
0
0
This entry is part 2 of 10 in the series CAD Trends 2016

We published the 2016 Worldwide CAD Trends Survey results last month and will publish more details specific to some of the most important trends in a series of blog posts over the next quarter.

Key Insight: This  post focuses on the CAD Trends with the best future CAD growth potential over the next 5 years for software developers and their partners.

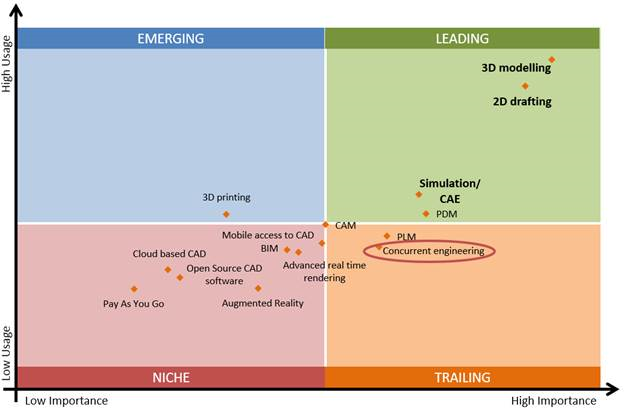
The CAD Trends which are currently the most important to users (3D Modelling, 2D Drafting) are reaching market saturation, as they have very high current usage and therefore relatively little scope to further expand their reach. So although current usage and perceived importance are still relatively low on what have been termed the more “niche” trends (see graph below), they are where the future growth lies.

CAD Trends 2016 importance and usage

The following graph presents the trends in the order of their growth potential ratio of the next 3-5 years.

CAD Trends 2016 - growth areas

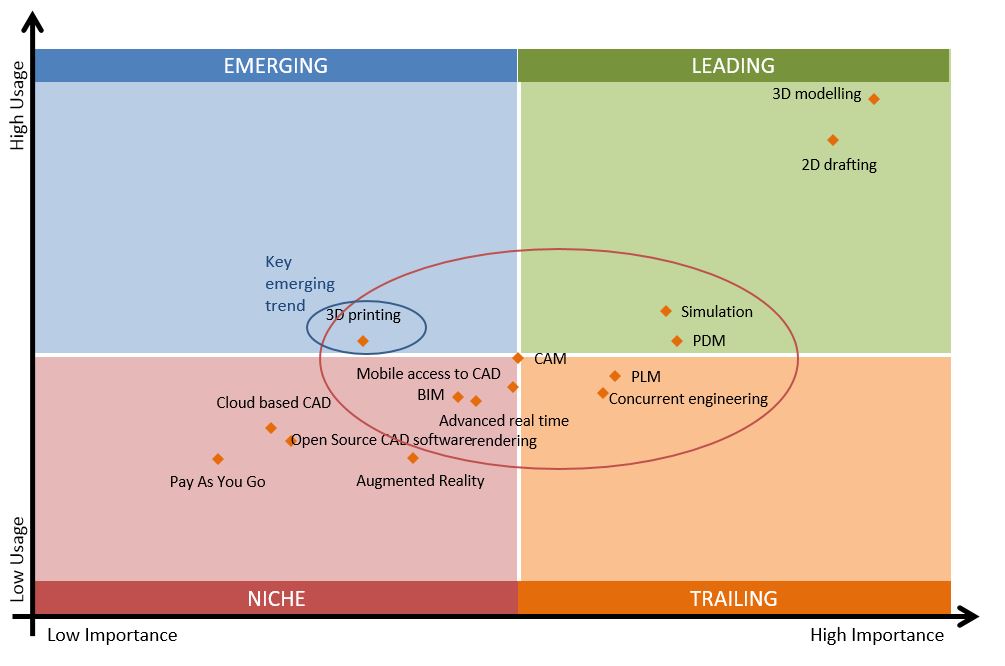
Below are the top 6 trends in terms of growth potential although most are based on a low number of current users. In terms of category, one of them, 3D Printing, has already moved from the ‘niche’ to the ’emerging’ category.

  • Pay As You Go – 240% (this encompasses various new CAD software  business models including term rental and subscription licensing)
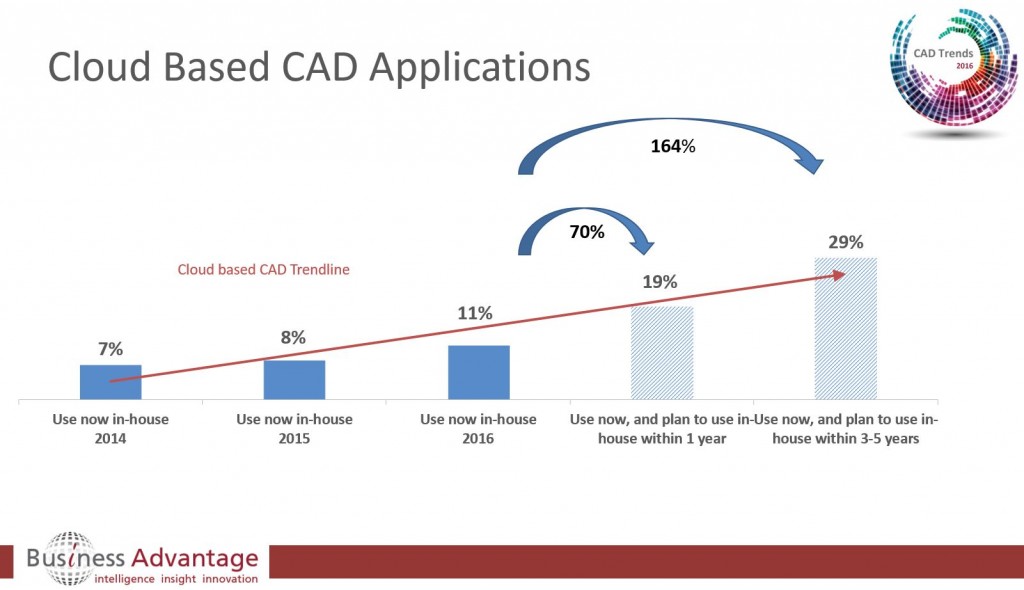
  • Cloud based CAD – 164%
  • Augmented/Virtual Reality – 140%
  • Mobile access to CAD – 118%
  • Advanced real time rendering – 88%
  • 3D Printing – 75%

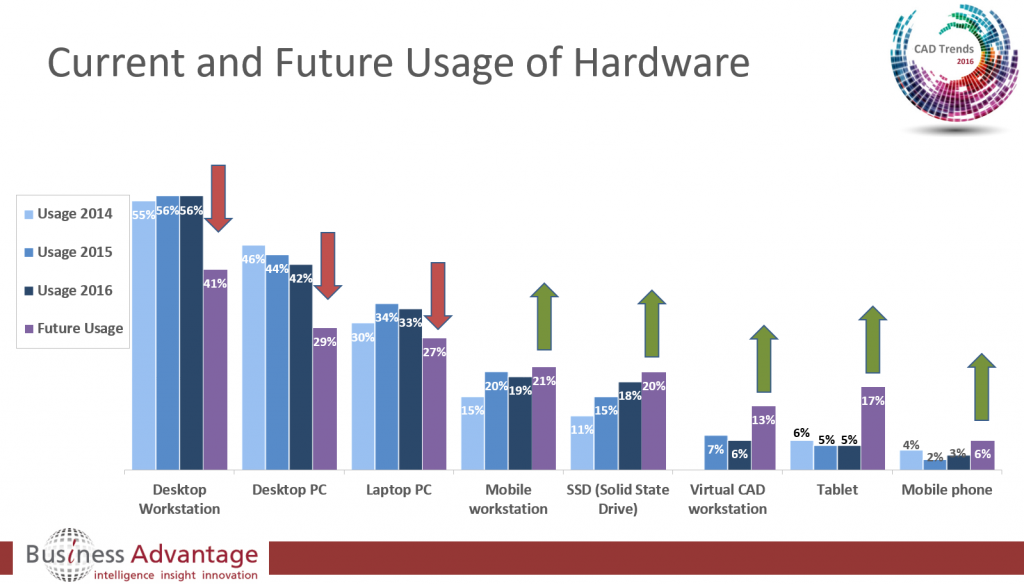
The following graph compares current usage with predicted additional usage in 1 year and in 3-5 years across all the CAD Trends researched. So here you can see that although Pay As You Go has high growth potential, in fact it has the lowest current usage.

CAD Trends 2016 - growth areas

Next steps?

  • Watch this blog for regular updates with more detail on other CAD trends from the 2016 Worldwide CAD Trends Survey.
  • Naturally the report is a high level summary of insights gained from the data gathered and this series of blog posts enables us to add further detail but if you are interested in still more detail, such as information on the CAD growth trends by region, industry or software vendor, give us a call to chat with a research executive about your needs.
  • Watch the CAD Trends 2016 webinar and other recorded webinars here.

The post Best Future CAD Growth Opportunities appeared first on Business Advantage's Blog.


3D Printing – CAD Users Viewpoint

$
0
0
This entry is part 3 of 10 in the series CAD Trends 2016

3D Printing Growth in CAD MarketThe 2016 worldwide CAD trends survey results were published last month.  This week we released more details specific to the 3D Printing Trend.

Key Insights: 3D Printing Usage in CAD Grew 27% Last Year, 32% More is Anticipated this Year and over 75% More within 5 Years

“3D Printing is currently used in-house by 28% of worldwide CAD users that responded to the survey and strong future growth is anticipated. This is up from 22% last year and 15% the year before. By the end of this year 37% expect to be using it in-house and in the next 5 years almost half (49%) of CAD users that responded expect to be using it in-house.“

Usage has increased significantly, but importance remains below average compared to other trends studied which indicates a growing niche for 3D printing in today’s market. There is significantly lower usage in AEC (10%) than all other industry sectors such as manufacturing (37%), lower usage in APAC (24%) than in EMEA (28%) and Americas (30%) and in small companies (19%) than medium (31%) or large (32%).

Growth is predicted in all sectors and regions. Across sectors it varies widely, for example, growth this year in manufacturing (excluding process and plants) is expected to be 27% (from 41% to 52% usage) but in AEC (excluding utilities) it is expected to grow 89% though from a much lower base (from 9% to 17% usage). Within 5 years usage is expected to be 65% in Manufacturing and 31% in AEC. Across all sectors current usage is highest in Education (69%) and Manufacturing (ex. process and plants) (41%) however usage in AEC, Utilities and Process and Plant industries are currently in the 9%-23% range.

This survey is just of CAD users, so it is only predicting growth related to that audience. 3D Printing has other applications such as additive manufacturing and overall growth in 3D Printing is likely to be even higher than this survey is predicting. Perhaps less encouraging for 3D Printer manufacturers is low brand recognition amongst CAD users with almost half (49%) being unable to name the brand they use. Of those that could name their brand, 1 in 4 (25%) use Stratasys, 1 in 6 (16%) use Makerbot, 1 in 10 (9%) use Objet, 3D Systems and Cubify.

Based on those CAD users already using or planning to use 3D printing the main benefits are seen as design improvements (59%), savings in design time (51%) and costs (30%), as well as faster response times to market (43%); confirming that product designers in particular have much to gain from 3D printing. The ability to 3D print low-cost physical prototypes early and locally is speeding up the design process by enabling tangible design checking and improvement of form, function and fit as well as testing customer reaction with fast iterations.

Next steps?

  • Watch this blog for regular updates with more detail on other CAD trends from the 2016 Worldwide CAD Trends Survey.
  • Naturally the report is a high level summary of insights gained from the data gathered and this series of blog posts enables us to add further detail but if you are interested in still more detail, such as information on the 3D Printing trend by region, industry or software vendor, give us a call to chat with a research executive about your needs.
  • Watch the CAD Trends 2016 webinar and other recorded webinars here.

The post 3D Printing – CAD Users Viewpoint appeared first on Business Advantage's Blog.

CAD 3D Modelling, 2D Drafting and Simulation CAE

$
0
0
This entry is part 4 of 10 in the series CAD Trends 2016

CAD Trends 2016 - 3D Modelling, 2D Drafting and Simulation

Key Insight: 3D Modelling and Simulation/CAE Use is Trending Higher but 2D Drafting Retains its Importance


This post publishes more specific details on three of the top trends (3D Modelling, 2D Drafting and Simulation CAE (Computer Aided Engineering)) from  the Worldwide CAD (Computer Aided Design) Trends 2016 Survey.

Of all the CAD trends studied 3D Modelling, 2D Drafting and Simulation CAE are the most important and the most used. Users rate the Importance of these trends as 8.4, 8.1 and 6.8 (mean scores out of 10) respectively. Awareness of these trends is respectively 87%, 75% and 55% and current Usage is 76%, 68% and 34%. Importance, Awareness and Usage are high across all industry sectors, regions and size of companies.  Future predicted growth potential is limited because the majority of relevant professionals are already using these capabilities but we’ll explore them individually below. However it’s notable that all these trends continue to grow including the use of 2D Drafting.

3D Modelling Usage and Growth Trend
3D modelling is a core and slow growth area in today’s market. Usage is expected to grow from 76% last in 2015 to 79% this year and to 81% over the next 3-5 years.  There is high current usage in manufacturing (81%) and other (85%) sectors (including government (79%) and education (100%)) and significantly lower usage in AEC (65%).  There is also significantly lower current usage in APAC (60%) than in EMEA (79%) or the Americas (80%) but propensity for growth is not higher in APAC. Large companies are more likely to be current users (85%), although 7 in 10 use in small (70%) and medium companies (73%). The AEC sector is closing the 3D Modelling usage gap on the Manufacturing sector with predicted growth up to 4 times higher than Manufacturing, over the next year and 3-5 years.

2D Drafting is a core and stable area in today’s market. There are similar levels of current usage across industry sectors but significantly lower current usage in APAC (42%) than in EMEA (71%) or the Americas (77%). Usage is expected to grow slightly from 68% last year to 69% this year and to 70% over the next 3-5 years.  Predicted growth is very limited in part due to high current usage, but also due to users shifting to 3D modelling. On average 39% of design work produces 2D drawings, 34% both 2D and 3D and 27% 3D.  Three-quarters (77%) feel 2D drawings automatically generated from 3D CAD or BIM to be important to their business – and a similar proportion feel that the same or more effort should be put into improving 2D drafting capabilities by CAD software suppliers (based on those using or planning to use 2D drafting –  420). This demonstrates the continuing importance of 2D Drafting in a 3D CAD world.

Simulation CAE – Usage is expected to grow from 34% in 2015 to 38% this year and to 43% over the next 3-5 years.  Simulation CAE saw a dip in stated usage from 2015 to 2016, although this is still higher than average – and is still seen as an important area in today’s market. Despite the decline in predicted usage in 2016, there is some potential for future growth, although at lower levels than some other trends. It is more likely to be used currently in large companies (45%) than small (28%) or medium (30%) companies.  As expected, there is significantly lower current usage in AEC (15%) than any other industry sector. Usage of Simulation CAE is seen mostly for design optimization (79%), design validation (73%) or prediction of product performance (67%) (based on those using or planning to use simulation – 270). The leading drivers for greater use of Simulation software are:

  • Ease of use for less experienced designers (46%)
  • A 50% cost reduction (34%)
  • Short term rental of licenses available on an as needed basis (24%)
  • Availability of expert support (23%)
  • Powerful hardware available on demand in the cloud (20%)

Some level of expert support for usage guidance is generally expected as part of the package (39% expect all support to be free, 28% expect some support to be free).

Conclusions and recommendations for software vendors:

  1. 3D Modelling remains the most important trend in the CAD Trends Survey, but even in 5 years’ time 19% of CAD users don’t anticipate using it. Almost two fifths (39%) of design work produces 2D drawings, 34% both 2D and 3D and 27% 3D. This may be a testament to the longevity of 2D Drafting and point to the need for CAD software suppliers to continue to improve their 2D tools for a sizable portion of users who use both 2D Drafting and 3D Modelling or don’t plan to use 3D Modelling at all.
  2. For Simulation, even in 3-5 years, only about 43% of CAD users expect to be using it. If CAE Simulation vendors want to increase usage of these tools, improved ease of use, lower cost, flexible licensing and Cloud based access are key to greater growth. Comparing Manufacturing and AEC, even in 5 years’ time, Manufacturing leads AEC by a wide margin which may indicate that there is opportunity for more applicable simulation tools in the AEC space.

Next steps?

  • Watch this blog for regular updates with more detail on other CAD trends from the 2016 Worldwide CAD Trends Survey.
  • Naturally the report is a high level summary of insights gained from the data gathered and this series of blog posts enables us to add further detail but if you are interested in still more detail, such as information on the 3D Modelling, 2D Drafting and Simulation CAE trends by region, industry or software vendor, give us a call to chat with a research executive about your needs.
  • Watch the CAD Trends 2016 webinar and other recorded webinars here.

The post CAD 3D Modelling, 2D Drafting and Simulation CAE appeared first on Business Advantage's Blog.

Buyer Persona Checklist (Part 7 of 7 Series)

$
0
0

7. Buyer Persona Checklist and Common Mistake List

The full details are in the previous posts of this series but the following two tables conveniently summarize the Buyer Persona development process with a tabulated Buyer Persona Checklist and table of the most common mistakes users initially make when developing personas. They don’t replace the detail of this post series but are useful aide-memoirs to ensure you follow the process and avoid at least some of the potential mistakes. You can save and print the images.

Buyer Persona Checklist

Buyerr Persona Common Mistakes


That completes this 7 post series on Buyer Personas and we hope you find it useful. If all this guidance and advice is overwhelming please talk to us about some Consultancy to help you figure out your best Buyer Persona research approach.

Good luck creating and using your Buyer, or other, Personas and please see this AUTODESK® CASE STUDY on how they created and successfully used Buyer Personas (Autodesk® is a leading software supplier for the CAD, CAM, CAE, PLM, PDM and many other markets).

The post Buyer Persona Checklist (Part 7 of 7 Series) appeared first on Business Advantage's Blog.

Cloud Based CAD, CAM, CAE, PDM, PLM

$
0
0
This entry is part 5 of 10 in the series CAD Trends 2016

Key Insight: 70% Growth Anticipated in Year Ahead, 164% within the next 5 Years

CAD Trends 2016 - CAD in the Cloud Growth

This post publishes more specific details on the CAD in the Cloud trend from the Worldwide CAD Trends 2016 Survey.

Cloud based CAD is currently in use by 11% of respondents and strong future growth is anticipated. By the end of this year (2016) around 19% (~70% growth) are expected to be using “Cloud based CAD”. This is likely to go up to 29% in the next 3-5 years (~160% growth). Clearly Cloud based CAD continues to be an area of interest in today’s market with strong future growth potential,” said Chris Turner, CEO/Managing Director of Business Advantage.

Cloud based CAD has ‘high awareness’ (58%) among CAD users, managers and executives and offers new business and delivery models for CAD/CAM/CAE/PDM/PLM software companies. Rather than software being deployed and used locally, Cloud based solutions enable the software to be loaded and run somewhere else but be accessible anywhere with an internet connection.   It’s worth noting that this is different from cloud based licensing in which software subscriptions are managed in the cloud but the software operates on local machines.

Research findings show….

  1. 2015-2020 Significant Growth Expected: 2016 Cloud based CAD growth is predicted at a healthy and significant ~70% (11% to 19% of all CAD users) and 3-5 year growth at ~160% (11% to 29%). Looking at individual sectors, in 2016 AEC (including utilities) Cloud based CAD is predicted to grow by 64% (14% to 23%) and Manufacturing Cloud based CAD is predicted to grow by 60% (10% to 16%). Over the next 3-5 years usage in AEC (including utilities) is predicted to grow by 135% (from 14% to 33%) and Manufacturing (including process and power) by ~160% (from 10% to 26%). There are some indications that long term future growth is more likely to come from the Americas and EMEA than APAC
  2. Importance: Compared to some of the other trends, Cloud based CAD, has a below average Importance ranking (mean score of 3.8 out of 10). Importance by sector varies, with AEC (including utilities) users rating this trend at 4.5 out of 10 and manufacturing (including process and power) users rating it at 3.4 out of 10. Therefore, at the present time, Cloud based CAD appears to be more important to AEC users, where the greater need for ‘mobility’ within the AEC sector contributes to the higher importance ratings
  3. Top Benefits: Based on those using or planning to use Cloud based CAD (~180) the top perceived benefits and productivity changes over all sectors are ‘higher mobility’ (67%) followed by ‘ease of updating software’ (47%), ‘cost reductions’ (46%), ‘increased storage capability’ (32%) and ‘better scalability’ (26%), but by individual sector some of these vary in significance. For example, ‘higher mobility’ scored 73% in AEC (including utilities) and 60% in Manufacturing (including process and power) and ‘increased storage capability’ scored 39% in AEC (including utilities)  and 29% in Manufacturing (including process and power)

Next steps?

  • Watch this blog for regular updates with more detail on other CAD trends from the 2016 Worldwide CAD Trends Survey.
  • Naturally the report is a high level summary of insights gained from the data gathered and this series of blog posts enables us to add further detail but if you are interested in still more detail, such as information on the CAD in the Cloud (Cloud based CAD) trend by region, industry or software vendor, give us a call to chat with a research executive about your needs.
  • Watch the CAD Trends 2016 webinar and other recorded webinars here.

The post Cloud Based CAD, CAM, CAE, PDM, PLM appeared first on Business Advantage's Blog.

PDM and PLM Trends & Growth

$
0
0
This entry is part 6 of 10 in the series CAD Trends 2016

Key Insight: Strong growth predicted in both PDM (Product Data Management) and PLM (Product Lifecycle Management) for this year and through 2020.

CAD Trends 2016 - PDM Growth

This post publishes more specific details on the PDM and PLM trends from the Worldwide CAD Trends 2016 Survey.

PDM (Product Data Management) is the third most important trend in our annual CAD Trends Survey with Awareness of PDM increasing year over year from 47% to 51%, while Usage remained level at 28%.  There is higher Usage in large companies (37%) compared to medium (30%) or small (16%) companies. There is predicted growth in both the short and longer term; Usage is predicted to grow from 28% this year to 39% over the next 3-5 years.  Regionally there is significantly higher usage in the Americas (36%) than EMEA (24%) or APAC (20%).

PLM_Growth

PLM (Product Lifecycle Management) is the fifth most important trend in the survey.  PLM Awareness increased from 46% to 54%, but Usage remained level at 21%.  PLM has higher current Usage in large companies (39%) than medium (16%) or small (10%) companies.  Regionally Usage is lower in APAC (13%) than the Americas (26%) – although short term growth is more likely to come from APAC or the Americas than EMEA. Overall Usage is predicted to grow from 21% this year to 35% over the next 3-5 years

In market share terms Siemens’ Teamcenter (25%) and PTC Windchill (20%) continue to be the main products in use.  Perceived benefits of PLM are:

  1. Savings on design time (43%)
  2. Design  improvements (38%)
  3. Cost savings (30%)
  4. Faster time to market (28%).

Where is the growth potential?  As expected use of PDM and PLM is much higher in Manufacturing than in other sectors such as AEC but there is growth potential in most sectors. Across all sectors, PDM Usage (28%) leads PLM Usage (21%) but more detailed analysis by sector and size of company highlights some growth opportunities:

  • In the Manufacturing Sector (including Process and Power) PDM and PLM Awareness is 61% and 66% respectively, Importance is 7.4 and 7.0 respectively and PDM Usage (40%) leads PLM Usage (33%). in 3-5 years PDM Usage is forecast to increase from 40% to 51% (28% growth) and PLM Usage is forecast to increase from 33% to 50% (51% growth).
  • In the AEC Sector (including Utilities) PDM and PLM Awareness is 35% and 39% respectively, Importance is 6.1 in both and PDM Usage at 15% leads PLM Usage at 8%. In 3-5 years PDM Usage is forecast to increase from 15% to 25% (67% growth) and PLM Usage to more than double from 8% to 21% (262% growth – although this is from a low base).
  • By size of company: In large companies Usage of PDM and PLM is similar at 37% and 39% respectively but the smaller the company the more likely they are to use PDM rather than PLM. In medium sized companies PDM Usage (30%) is nearly twice (88% higher) than PLM Usage (16%) and in small companies PDM Usage (16%) is 60% higher than PLM Usage (10%).

Next steps?

  • Watch this blog for regular updates with more detail on other CAD trends from the 2016 Worldwide CAD Trends Survey.
  • Naturally the report is a high level summary of insights gained from the data gathered and this series of blog posts enables us to add further detail but if you are interested in still more detail, such as information on the PDM and PLM trends by region, industry or software vendor, give us a call to chat with a research executive about your needs.
  • Watch the CAD Trends 2016 webinar and other recorded webinars here.

The post PDM and PLM Trends & Growth appeared first on Business Advantage's Blog.

How CAD Decision Makers and Users Value Different Sources of Information

$
0
0
This entry is part 7 of 10 in the series CAD Trends 2016

Key Insight: How CAD Decision Makers and Users Value Different Sources of Information – Each Group has Different Preferences for Staying Up-to-Date with CAD

Preferred sources of information on CAD software

This post publishes more specific details on trends in CAD decision maker’s and user’s preferences for staying up to date with the latest CAD industry developments from the Worldwide CAD Trends 2016 Survey.

The survey results are based on responses from CAD users, Designers, Engineers and Professionals including managers and senior executives. For CAD professionals it’s interesting to know peer preferences but for CAD suppliers it is vital to know their target audience’s preferences for staying up to date – in order to plan effective marketing.

Overall, usage of information sources in 2016 has remained stable from 2015, after increases in 2014. The above chart has already been published in the full results and shows consolidated results for all job types – but favoured media differs considerably by job title, therefore marketing to reach senior managers, CAD managers or engineers should use different strategies. Similarly, different preferences are seen within industry sector, again requiring different approaches.

Preferred sources of information on CAD software by job title

All three job function groups use internet search engines as their most popular source of CAD information. Of course, search engines are more a method of finding information rather than a source of information but this emphasizes the huge importance of Search Engine Optimization (SEO) and Search Engine Marketing (SEM) for all suppliers of CAD systems, software and services.

Highest ranking sources of information on CAD software
Lowest ranking sources of information on CAD software

For vendors it is obviously very important to know which sources of CAD information are preferred by different audiences so they can most effectively reach each target group,” said Chris Turner, CEO/Managing Director of The Business Advantage Group.

Next steps?

  • Watch this blog for regular updates with more detail on other CAD trends from the 2016 Worldwide CAD Trends Survey.
  • Naturally the report is a high level summary of insights gained from the data gathered and this series of blog posts enables us to add further detail but if you are interested in still more detail, such as information on media preferences by region or industry,  give us a call to chat with a research executive about your needs.
  • Watch the CAD Trends 2016 webinar and other recorded webinars here.

The post How CAD Decision Makers and Users Value Different Sources of Information appeared first on Business Advantage's Blog.

CAD Users’ Usage of CAM

$
0
0
This entry is part 8 of 10 in the series CAD Trends 2016

Key Insight: 34% of CAD Users Increased Their Use of CAM Last Year

Computer Aided Manufacturing (CAM) Growth

This post publishes more specific details, including awareness, usage statistics and growth predictions on the Computer Aided Manufacturing (CAM) trend from the Worldwide CAD Trends 2016 Survey.

The survey results are based on responses from CAD users, Designers, Engineers and Professionals including managers and senior executives.

Based on feedback, we added CAM as a CAD Trend to the latest annual survey and gained many useful insights as a result – some examples  are shared below,” Chris Turner, CEO of Business Advantage Group.

  • Future CAM software growth potential is predicted as 17% (from 24% to 28% Usage) this year and 29% (from 24% to 31% Usage) over the next 3-5 years.
  • CAM Usage is significantly lower in smaller companies (19%) than in medium companies (28%) or large (26%) companies.
  • Overall 56% of CAD users are aware of CAM, 24% currently use it and it ranks 7th out of 15 in Importance across all the trends. Overall rankings are very useful to compare all the trends; however, some trends are mostly relevant to particular industry segments. As expected in CAM, there is significantly higher usage in Manufacturing (34%) than in AEC – Architecture, Engineering & Construction (9%) or other industries.
  • Looking at just those that use or plan to use CAM software :
    • 34% of them increased their usage of it over the past year, 48% used it about the same amount as the previous year and 4% saw a decrease. This indicates continuing potential to maintain and up-sell current users.
    • 70% think it’s “important” (36% think it is “very important” and 34% “quite important”) to have machining instructions automatically generated from 3D CAD models.
    • 6 in 10 (61%) want to see “more” (half of them want to see “much more”) software development effort on CAD/CAM integration.
    • The most used CAM software products are MasterCAM (20%), NX CAM (14%), InventorCAM (10%), SolidCAM (9%) and CAM for Fusion 360 (8%).

“All this portends well for increased focus on CAM by CAD vendors but please also see our earlier blog post on the 3D Printing Trend which is obviously providing additive manufacturing so is a closely related trend to CAM.”

Next steps?

  • Watch this blog for regular updates with more detail on other CAD trends from the 2016 Worldwide CAD Trends Survey.
  • Naturally the report is a high level summary of insights gained from the data gathered and this series of blog posts enables us to add further detail but if you are interested in still more detail, such as information on CAM usage or growth predictions by region or industry,  give us a call to chat with a research executive about your needs.
  • Watch the CAD Trends 2016 webinar and other recorded webinars here.

The post CAD Users’ Usage of CAM appeared first on Business Advantage's Blog.


CAD Trends in Concurrent Engineering

$
0
0
This entry is part 9 of 10 in the series CAD Trends 2016

Key Insight: For Concurrent Engineering 33% Growth Anticipated in the Year Ahead, 72% within 5 Years

CAD Trends 2016 - Concurrent Engineering Growth Prediction
This post publishes more specific details on the Concurrent Engineering Trend from the Worldwide CAD Trends 2016 Survey.

The survey results are based on responses from CAD users, Designers, Engineers and Professionals including managers and senior executives.

“Concurrent Engineering through CAD collaboration, defined as multiple users working on a single model in real time, continues to be an area of interest in today’s market with relatively low current usage implying plenty of opportunity for the growth that survey respondents predict.” – Chris Turner, CEO of Business Advantage Group

For Concurrent Engineering the growth predicted in the 2015 report did not materialize – usage has remained flat (19%-18%) through 2015. Users continue to rate its Importance highly – it is the 6th most important CAD trend from the survey. Like PLM, Concurrent Engineering is a trailing trend – high importance coupled with relatively low usage. However users continue to predict growth33% this year (from 18% to 24% usage) and 72% within 5 years (from 18% to 31%).

Concurrent Engineering is an Important but Trailing CAD Trend

Awareness of Concurrent Engineering is 52% in large companies, 45% in medium sized companies and 39% in small companies. Similarly, Usage is higher in large companies (28%) than in medium sized companies (17%) or small companies (9%) and long term future predicted usage is also higher in the larger companies. Usage is highest in North America (21%) compared to EMEA (16%) or APAC (14%).

The leading reason given for not using Concurrent Engineering was incompatibility with existing systems which is obviously a prerequisite for multiple users working on a single model real-time.

There is further indication in the survey of greater growth potential – a separate but related survey question asked what collaboration, data and information management tools respondent’s use? The top 10 leading software tools by market share (current usage for these purposes) are listed below. The highest market share for a single software solution is just 12% and there is no clear market leader although from a vendor point of view Autodesk leads with 5 of the top 10 software solutions!

  • Design Review: 12% (mainly in AEC at 17%, 17% of Autodesk users also use Design Review)
  • Vault: 11% (16% of Autodesk users also use Vault)
  • Navisworks: 11% (mainly in AEC at 21%, 15% of Autodesk users also use Navisworks)
  • Windchill: 8% (mainly in manufacturing at 12%, 42% of PTC CAD users also use Windchill)
  • A360: 8% (mainly in AEC at 12%, 11% of Autodesk users also use A360)
  • Teamcenter: 7% (mainly in manufacturing at 14%, 42% of Siemens CAD users also use Teamcenter)
  • Buzzsaw: 5% (mainly in AEC at 11%, 7% of Autodesk and 6% of PTC users also use Buzzsaw)
  • ProjectWise: 4% (mainly in AEC at 7%, 38% of Bentley users also use ProjectWise)
  • Enterprise PDM: 4% (mainly in Manufacturing at 6%, 12% of Dassault users also use Enterprise PDM)
  • ProjectWise: 4% (mainly in AEC at 7%, 38% of Bentley users also use ProjectWise)

Also, in answering the question above, 50% either did not use these tools or could not say which brand was used (41% selected “Do not use any” and 9% selected “Don’t know/cannot say”).  Looking more deeply, the “Do not use any” answer varies greatly by company size – 12% in large, 49% in medium, 58% in small.

Next steps?

  • Watch this blog for regular updates with more detail on other CAD trends from the 2016 Worldwide CAD Trends Survey.
  • Naturally the report is a high level summary of insights gained from the data gathered and this series of blog posts enables us to add further detail but if you are interested in still more detail, such as information on Concurrent Engineering usage or growth predictions by region or industry,  give us a call to chat with a research executive about your needs.
  • Watch the CAD Trends 2016 webinar and other recorded webinars here.

The post CAD Trends in Concurrent Engineering appeared first on Business Advantage's Blog.

CAD Augmented and Virtual Reality Growth Predictions

$
0
0
This entry is part 10 of 10 in the series CAD Trends 2016

Key Insight: 60% Growth Anticipated in 2016, 140% by 2020

This post publishes more specific details on the CAD Augmented and Virtual Reality Trend from the Worldwide CAD Trends 2016 Survey.CAD augmented and virtual reality growth predictions

“We see Augmented Reality (AR) as a spectrum with pure reality at one end and wholly Virtual Reality (VR) at the other end. Currently for CAD users, managers and executives this trend has low current usage & importance, but very strong future growth potential is predicted by survey respondents,” – Chris Turner, CEO of Business Advantage Group.

augmented_virtual_reality_spectum

The CAD Augmented and Virtual Reality Trend is ranked 11th most important of the 15 trends CAD Trends we studied but its Importance is increasing – from 4.5 to 4.9 (out of 10) between late 2014 and late 2015. In the same period Awareness of CAD Augmented and Virtual Reality increased, from 18% to 22%, and Usage also increased, from 3% to 5%. In terms of users, about 1 in 20 CAD users is using AR/VR technology and this applies across all industry sectors, company sizes and geographic regions. However, CAD users are predicting fast growth albeit from a low base – 60% this year (from 5% to 8% Usage) and 140% within 5 years (from 5% to 12% Usage) – by 2020. There is no particular standout area for the predicted future growth – similar levels are seen across all subgroups.

“Augmented Reality is a very exciting and fast developing trend with practical use cases in many industries. For example in AEC, during the design phase for collaboratively developing design intent between all stakeholders, during pre-construction for training and communicating design intent with the on-site team, during construction for monitoring progress and quality, then in facility management during the life of the structure for monitoring maintenance history. A key point for CAD software developers, who are under pressure to figure out what they’re doing with AR, is the user interface (UI) which, of course, needs to be very different from the UI we all so familiarly use on a flat computer screen. Compare the simplicity of the new Pokémon Go game to AR visions in CAD that have sometimes been too complicated and haven’t taken off. Based on other recent research we’ve done, we predict many more AR software apps in the market in the coming years.”

The survey results are based on responses from CAD users, Designers, Engineers and Professionals including managers and senior executives.

Next steps?

  • Watch this blog for regular updates with more detail on other CAD trends from the 2016 Worldwide CAD Trends Survey.
  • Naturally the report is a high level summary of insights gained from the data gathered and this series of blog posts enables us to add further detail but if you are interested in still more detail, such as information on CAD Augmented and Virtual Reality usage or growth predictions by region or industry,  give us a call to chat with a research executive about your needs.
  • Watch the CAD Trends 2016 webinar and other recorded webinars here.

The post CAD Augmented and Virtual Reality Growth Predictions appeared first on Business Advantage's Blog.

Market Opportunity Studies

$
0
0

In  a fiercely competitive industry the ability to carve out a new market can be the key to success.  But launching into a new market requires an understanding of the opportunities, risks, competitors, potential customers and other key players via market opportunity studies.

To make an informed decision about a new market, you need to quantify the potential demand for your product or service and find out how this need is currently being met; a Market Opportunity Study will determine which geographical or industry segments should be targeted for future investment.

Research into the potential of new markets can enable you to:

  1. better understand your current market
  2. identify other niches within this market
  3. identify a new market altogether
  4. understand characteristics/needs of prospects in the new market and plan a marketing strategy
  5. understand the threats you will face and plan to counter them accordingly
  6. ultimately – achieve the objective of increased revenue.

Learn all these things via market opportunity studies.

The post Market Opportunity Studies appeared first on Business Advantage's Blog.

Competitor Analysis

$
0
0

To  compete successfully you have to know who you are up against! Competitor Analysis is the in depth analysis on your major competitors, or new players entering your target markets – such as their structure, products/services, strategy, strengths and weaknesses, opportunities and threats – enables you to really focus on targeting resources where they will have the most impact.

Analysis of the competitive landscape will help you to:

  1. understand competitors’ objectives and strategy and develop your own accordingly
  2. develop realistic sales targets through understanding the scale of competitors’ operations and revenue
  3. identify relative market positions
  4. identify each competitor’s market share
  5. identify the split of competitors by product
  6. conduct a gap analysis on product features
  7. implement product or service improvements to counter strengths/weaknesses and innovations in their product portfolio
  8. position your products/services appropriately
  9. understand the distribution strategies of your competitors and optimize your own
  10. offer competitive pricing discounts and payment terms
  11. develop a marketing communications strategy with messages that resonate effectively with your target market and counteract your competitors’ messages
  12. strengthen your products/services and marketing strategy according to how your competitors and their products are perceived by customers
  13. identify new product development and competitive product road maps
  14. develop sales guides highlighting sales “kill points”, i.e. points designed to counter specific competitor offerings and communications
  15. understand competitor customer satisfaction levels
  16. conduct lost bid analysis
  17. define research and development investment.

Competitor AnalysisCompetitor analysis is a large, complex and specialist study; decide first what your needs are, and therefore which avenues you need to explore, and plan your research in detail ensuring you apply the appropriate technique or methodology to gain the best results.  Approaching various sources will be necessary – competitors’ employees and customers, channel partners and maybe former employees – make sure you have the expertise available to conduct this research to maximize the information gathered and ensure you are aware of ethical and legal considerations.

Effectively completed, competitor analysis is technically challenging, complicated and resource-hungry work that is best left to experts that specialize in the competitor intelligence and analysis field.

The post Competitor Analysis appeared first on Business Advantage's Blog.

BIM Trends (Building Information Modelling)

$
0
0
This entry is part 11 of 11 in the series CAD Trends 2016

Key Insight: 38% of AEC Sector Uses BIM Now, Heading to 51% this Year

This post publishes more specific details on BIM Trends (Building Information Modelling) from the Worldwide CAD Trends 2016 Survey.
BIM (Building Information Modelling) growth

“BIM has been in flux over the last year with predicted growth not met. However, 19% of professional CAD users and managers across all industry sectors now use BIM and that is forecast to grow to 29% in the next 3-5 years. BIM current and future usage unsurprisingly will continue to be dominated by the Architecture, Engineering and Construction (AEC) sector. In the AEC sector 38% of respondents use BIM now, users predict 34% growth this year to 51% using BIM.” – Chris Turner, CEO of Business Advantage Group.

BIM continues to be a very significant trend in the CAD market, the 7th most important of the 15 studied in this year’s report and one of the leading trends as it has both ‘high importance’ and ‘high usage’. Interestingly there is 5% usage of BIM in the Manufacturing sector and that is expected to increase to 10% in the next 3-5 years.

Overall, BIM users (as well as those planning on using BIM) perceive the main benefits of using BIM to be:

  • Design improvements (62%)
  • Savings on design time (47%)
  • Cost savings (40%)
  • Faster response time to market (35%)

Current BIM usage is highest in large companies (30%) and about the same in medium sized (15%) and small (13%) companies. By Region, current BIM usage is highest in EMEA (22%) and N. America (20%), followed by APAC (11%).

Obviously the BIM trend moves users from 2D drawings to 3D models and we wondered therefore if the importance of 2D drawings is diminishing. The survey asked, “How important to your company are 2D drawings which are automatically (either fully or partially) generated from 3D CAD or BIM models?” 45% of AEC users report that the importance of 2D drawings has not changed, 27% report a net decrease in importance and 23% report a net increase – so the main message is that the overall importance of 2D drawings remains the same and is not diminishing as a component of AEC design.

  • Watch this blog for regular updates with more detail on other CAD trends from the 2016 Worldwide CAD Trends Survey.
  • Naturally the report is a high level summary of insights gained from the data gathered and this series of blog posts enables us to add further detail but if you are interested in still more detail, such as information on CAD Augmented and Virtual Reality usage or growth predictions by region or industry,  give us a call to chat with a research executive about your needs.
  • Watch the CAD Trends 2016 webinar and other recorded webinars here.

The post BIM Trends (Building Information Modelling) appeared first on Business Advantage's Blog.

Benchmarking

$
0
0

You  need benchmarking because it isn’t enough just to know what your own sales figures are, or that the average battery life on your product is 11 hours before recharging is required, or the fact that 95% of your customer support calls are resolved within 8 hours.  In an ever increasingly competitive world, you need to know what the expectations of your customers are, how you rank against this and also how your competitors rate – if their figures show that their average battery life is 22 hours, and 99.5% of customer support calls are resolved within 6 hours who looks the more attractive to the potential customer?

Benchmarking is the process of comparing factors such as cost, quality, product features and functionality, scope, service, response and availability of your offering against competitors in the same market – whether that be geographic or industry sector.  By creating a comparative matrix of your competitors’ product or service offerings you have the beginnings of a business case to make any necessary improvements and develop an optimum offering.

As with most other elements of a market analysis study, benchmarking will include both secondary and primary research methodologies.

Benchmarking yourself not only against competitors but also against companies of a similar standing to yours in other industries will provide you with additional valuable insight.

A note of caution – speaking with competitor personnel or with personnel from companies in other industries must be handled sensitively and it is recommended this benchmarking stage of an analysis project be conducted by highly trained and experienced analysts and interviewers.

The post Benchmarking appeared first on Business Advantage's Blog.

Upgrades Increase CAD Productivity

$
0
0
This entry is part 12 of 12 in the series CAD Trends 2016

Key Insight: CAD Users who upgrade their CAD software see 16% Productivity gains in ~2 months

This post publishes more specific details on the CAD productivity impact of software upgrades from the Worldwide CAD Trends 2016 Survey.

CAD upgrade productivity incease averages 16% within 2 months

These survey results are based on responses from CAD users, Designers, Engineers, Professionals including managers and senior executives. Almost half of those surveyed had upgraded (34%), changed their primary CAD Software (6%) or added an application to their CAD software (9%) in the last 12 months. To determine the business value of software upgrades we asked those who had made these changes a series of questions around productivity during their transitions – the CAD productivity changes are the individual users’ own assessments as percentage increases or decreases in their productivity.

  1. Was there a temporary loss of productivity soon after implementing or upgrading your CAD software?
  2. What was the loss of productivity soon after implementing or upgrading your CAD software?
  3. For how long did the loss of productivity last?
  4. Once your company learned the new software what productivity increase have you achieved over the previous way you worked?

The results show that on average CAD users’ productivity breaks even in just over 2 months (an improvement since 2014, stable since 2015) after a CAD software upgrade and thereafter continues to produce productivity gains. 57% reported no loss of productivity during the upgrade process and 30% acknowledged a temporary loss in productivity (the other 13% didn’t know or couldn’t say). The average loss while learning the upgraded version was 17% and this lasted an average of 4.4 weeks (for comparison, in 2015, the average loss was 18% and it lasted for 4.2 weeks).

Based on the survey findings, we can therefore conclude that CAD software upgrades are delivering a net productivity gain and hence real business value to CAD users.

  • Watch this blog series for regular updates with more detail on other CAD trends from the 2016 Worldwide CAD Trends Survey.
  • Naturally the report is a high level summary of insights gained from the data gathered and this series of blog posts enables us to add further detail but if you are interested in still more detail, such as information on CAD Augmented and Virtual Reality usage or growth predictions by region or industry,  give us a call to chat with a research executive about your needs.
  • Watch the CAD Trends 2016 webinar and other recorded webinars here.

The post Upgrades Increase CAD Productivity appeared first on Business Advantage's Blog.


Current and Future Hardware Usage for CAD

$
0
0
This entry is part 13 of 13 in the series CAD Trends 2016

Key Insight: For CAD, Desktop Hardware usage is forecast to decline, Mobile and Virtual Hardware usage to increase.

This post publishes more specific details on current and future intended usage of different hardware for CAD from the Worldwide CAD Trends 2016 Survey. These survey results are based on responses from CAD users, Designers, Engineers, Professionals including managers and senior executives.

Current and future hardware usage for CAD

Hardware usage for CAD: current usage for desktop based hardware solutions is stable though a significant decline in future demand is predicted by survey participants. There are increases forecast in usage and demand for tablets, virtual solutions and in mobile phone usage (but from a low base).

At present, 56% of CAD users utilize Desktop Workstations, 42% PCs and 33% Laptop PCs, this is stable across the last three years however, future usage is predicted to be much lower. On the other hand 19% of CAD users currently utilize Mobile CAD Workstations, 6% Virtual CAD Workstations, 5% Tablets and 3% Mobile Phones. Overall, CAD users are predicting significant increases in the usage of Virtual CAD Workstations, Tablets and Mobile phones. Virtual CAD workstation and Mobile Phone usage is predicted to double and to triple for Tablets.

Certain types of hardware are slightly more prevalent by sector, for example, Desktop Workstations are currently used by 55% in Manufacturing, 60% in AEC and these percentages are forecast to drop to 32% and 50% respectively over the next 3 to 5 years. Desktop PCs are currently used by 39% in Manufacturing, 42% in AEC and are forecast to drop to 28% and 32% respectively. Laptop PCs are currently used by 32% in Manufacturing, 30% in AEC and are forecast to drop to 31% and 18% respectively.

On the other hand Mobile Workstations are currently used by 19% in Manufacturing, 21% in AEC and these percentages are forecast to be steady in Manufacturing but grow to 25% in AEC. Virtual CAD workstation use is currently 5% in manufacturing and 9% in AEC and the forecast is for both to increase to 12%. Tablets usage is currently 5% in Manufacturing and AEC, forecast to grow to 17% in Manufacturing and 18% in AEC.

Clearly hardware vendors should anticipate replacing shrinking PC and desktop workstation hardware usage for CAD  with increasing opportunities in Virtual Workstations and Tablets.

  • Watch this blog series for regular updates with more detail on other CAD trends from the 2016 Worldwide CAD Trends Survey.
  • Naturally the report is a high level summary of insights gained from the data gathered and this series of blog posts enables us to add further detail but if you are interested in still more detail, such as information on CAD hardware usage or growth predictions by region or industry,  give us a call to chat with a research executive about your needs.
  • Watch the CAD Trends 2016 webinar and other recorded webinars here.

The post Current and Future Hardware Usage for CAD appeared first on Business Advantage's Blog.

Voice of the Customer

$
0
0

“People  buy what they need from those who understand what they want” (Bill Brooks and Tom Travesano).

Learning  what customers want entails listening to the voice of the customer and there are many focused types of market research that often can and should be part of a programme to better understand what customers want.

  • Usage and attitude studies investigate all aspects of the relationship between your customers and your product or service. They can provide the basic foundations for much of your marketing activity by giving you a full understanding of the market you are currently selling into, or planning to target, reveal trends, identify current or possible future problems and establish the demand for related products.  It is only by understanding your customers’ or prospects’ needs and what they are doing and why, that you can deliver the right product or service to them in the right place at the right time.  Usage and attitude studies will recognise that as markets have become more complex, and niche marketing more commonplace, so brand usage, habits and attitudes may differ according to different types of use or different user groups.  Such a study will give you the ability to segment your chosen market according to particular types of use or user groups, thus identifying potential gaps in the market.  For example, you may wish to establish:
  1. who is already using a specific technology/software
  2. who is planning to and why
  3. what they are using it for or planning to use it for
  4. why these chose that solution over any other
  5. why they use their current supplier
  6. any planned changes in use or supplier
  7. the perceived image of the current supplier
  8. an understanding of the decision making process.
  • Image and awareness studies establish how you and your competitors are perceived in the market and has profound implications for the development of your marketing strategy. Seeing your business through the market’s eyes and measuring awareness of your brand will be the basis for highly targeted action that leads to sustained competitive advantage and an increase in brand value.  Those having decision making influence on the purchasing process often make their decisions based partly on their perception of the market position of supplier brands.  They will tend to favour brands that closely match their desired attributes –   determining which attributes are currently most valued by the market will enable market positioning to meet those needs and better equip you to develop positioning statements.  As well as the standard brand image type questions to pose to the selected target recipient audience such as:
  1. How do they perceive your company/product/service?
  2. How do you compare with your market competitors?
  3. What attributes and values are most associated with your company within the target group?
  4. What is the general level of awareness of your company?

Consider breaking awareness questions down further:

  1. Unaided or spontaneous awareness – the extent to which customers/users think of your company or product/service on a “top-of-mind” basis – who comes to mind first
  2. Aided awareness – the extent to which those who know of your company or product/service are familiar with who you actually are or what you provide.

You should then be able to start building a picture of your overall reputation, the quality and appeal of your product/service, the effectiveness of your sales, marketing and customer service/support and how receptive the market is to your cost model.  From there, this information can form the basis of your future marketing and operational strategies, targets, product and service design and market presentation, costs and staff/internal infrastructure.

    • Customer satisfaction studies are vital to understand what is really important to your customers and their views of the product or service you are offering – whether your existing customer base is global, confined to a particular country or region, niche market or cross sector. You have to know what the key drivers for customer loyalty are – and conversely what the causes and effects of customer dissatisfaction are – as the basis for your marketing plans.  A two-staged approach – firstly establishing which areas of products or services are important to your customers (qualitative) and secondly conducting detailed interviews with a large sample of your customers to provide statistically reliable data on the areas identified in the first stage (quantitative) – will maximize your chances of:
      • understanding how your customers perceive your business
      • improving on areas that are failing to match the quality of product or service demanded
      • taking urgent action on groups of customers identified as “at risk”
      • setting realistic targets and effectively monitoring them to be able to react to early warnings of a change in customer expectations
      • monitoring customer loyalty
      • increasing your active customer base – decrease customer acquisition costs while increasing repeat business.
  • Competitor customer satisfaction studies identify what is important to a competitor’s customers, and provides an insight into how they evaluate their supplier. Consider a mix of targets for interview – by company type, company size, industry sector, respondent job function, etc.

Include points such as:

  • how satisfied/dissatisfied are they with the product or service deployed?
  • would they buy from this company again?
  • why/why not?
  • how likely/unlikely are they to recommend the supplier?
  • what would they like to see improved in the competitor’s products/services?
  • what are the best and worst features/elements of the existing product or service?
  • would they consider using an alternative company’s product or service?

Answers to these and other questions will provide you with both market intelligence and specific knowledge of existing opportunities to win competitor’s customers.  Specific areas to focus on internally in order to develop winning strategies, and increase market share and customer satisfaction will be highlighted.

Voice of the Customer

  • Pricing studies can make companies more profitable – increasing prices can have an immediate and significant effect. How to create a pricing strategy, do price research and implement product pricing without lowering sales volumes or upsetting customers is the subject of the Business Advantage white paper 6 Steps to Better Pricing Decisions.
  • And more … talk to us about your business problems and we may together solve them through one of these types of ‘voice of the customer’ market research.

The post Voice of the Customer appeared first on Business Advantage's Blog.

Cloud Adoption by CAD/CAM/CAE Users is Accelerating

$
0
0

CAD in the Cloud – Market Trends 2017 Jon Peddie Research (JPR) and Business Advantage Group (BA) have announced the availability of their co-created report on CAD in the Cloud (CiC) to present a 2017 view of trends in this market. The report is based on a custom designed survey, fielded worldwide, together with other … Continue reading Cloud Adoption by CAD/CAM/CAE Users is Accelerating

The post Cloud Adoption by CAD/CAM/CAE Users is Accelerating appeared first on Business Advantage's Blog.

Manufacturing CAD Decision Makers Preferred CAD Information Sources

$
0
0

How do CAD users and decision makers prefer to stay up to date with the latest industry developments?  How do decision makers and users prefer to consume CAD information?  For manufacturing CAD suppliers, it is vital to know your target audience’s preferences for staying up to date – in order to plan effective marketing. This post … Continue reading Manufacturing CAD Decision Makers Preferred CAD Information Sources

The post Manufacturing CAD Decision Makers Preferred CAD Information Sources appeared first on Business Advantage's Blog.

New Market Research: Construction Project Management Tools

$
0
0

Key Insight: The market for US construction project management software solutions is very fragmented.  Business Advantage regularly conducts research projects in the construction sector. This research project was conducted among US construction companies to understand the usage of construction project management software. We identified 6 key activity areas in which project management software is used … Continue reading New Market Research: Construction Project Management Tools

The post New Market Research: Construction Project Management Tools appeared first on Business Advantage's Blog.

Viewing all 22 articles
Browse latest View live


Latest Images